Cart is empty
Categories
New Model of Cross-Beam Sensor and Triple-Ball Module
New Model of Cross-Beam Sensor and Triple-Ball Module
Specializing in the professional developing and manufacturing of sensor, South Ocean Sensor Manufacturing Company has been working on developing cross-beam load cells since 2007. With years of research and efforts, we have designed the first cross-beam load cell and got NTEP approval in 2012. (CC# 12-046A1)
This article illustrates the features of the cross - beam sensor by explaining the structure of both the sensor and its parts as well as introducing the related experimental data of the sensor.
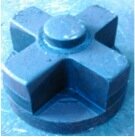
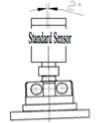
The cross-beam sensor is mainly constructed by elastomer, the baseboard (options available), connecting screws (options available). The top view of the model looks like a ‘cross’, which is the origin of the model’s name. Reference picture: Figure.1.
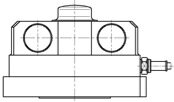
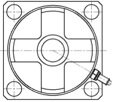
Front View Top View
Figure 1.
Sensitivity Calculation
In order to simplify the calculation, the cross-beam sensor could be regarded as four groups of I-Shaped Beam. Reference picture: Figure.2.
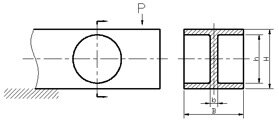
Figure 2.
The shear stress calculation of the I-Shaped Beam’s Section shall utilize The Zurawski Formula
![]() Whereas:
Whereas:
Shearing Force
Q=P/4
The Static Distance between
Sy shearing section and the Neutral Axis
The calculation of Sy (1)
The I -Shaped Beam could be regarded as composed of three rectangular sections
As for the wing rafter:
![]() (2)
(2)
As for the web:
![]() (3)
(3)
Take (2) and (3) into the following equation, then get:
![]() (4)
(4)
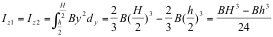
The area moment of inertia of the cross – section of Iz to the neutral axis
The I – Shaped Beam could be regarded as composed of three rectangular sections
As for the wing rafter:
 (5)
(5)
As for the web:
![]() (6)
(6)
Take (5) and (6) into the following equation, then get:
![]() (7)
(7)
The variation happens along the 45 °of the neutral axis matches the pure shear condition, thus:
Take (4) and (7) into (1), then get
![]() (8)
(8)
![]() (9)
(9)
Within the proportional limit of shear, the shearing stress and the shearing strain are in accordance with the Hooke’s Law:
![]() (10)
(10)
![]() (11)
(11)
![]() (15)
(15)
Take (9) and (11) into (15), then get:
![]() (16)
(16)
Sensor output
![]() (17)
(17)
Whereas i is the empirical factor, for the Cross-beam sensor, i=0.85
Take a 30 t cross-beam as an example, the reserved sensitivity temperature compensation, B=36 (mm, without specification, the length unit listed hereinafter are all mm); b=10; H=44; h=28, take the data into (17), then get s=2.25mV/V.
The manufacture of the elastomer
Since the fact that the structure of the cross-beam sensor is relatively complicated, the traditional manufacture method is inefficient – a waste for both time, and material, which decreases the practicability of mass production. Our company, however, takes a bold renovative manufacture technique - introducing the die forging process into the manufacturing of the sensor. We utilize the die forging mold to strike the barstock into the roughcast of the cross- beam (see picture below):
3. Performance test conditions.
The essential process after the successful installation of the truck scale is the adjustment of the section difference. One of the major causes of the section difference is the inconsistency of sensitivity of various sensors. There are two major causes for the inconsistency of sensitivity: one is that the default sensitivity of the sensors varies, the other is that the sensor is not installed vertical so that the stress point is not at the center.
Regards to the first cause, the factory could easily control the default sensitivity credit with the improvement of the test equipment’s precision. As we can indicate from Figure.1, the cross-beam sensor is structured by the elastomer and the baseboard connected by the connecting screws. It is widely known with the industry that the bolt pretension of the connecting screws could influence the sensitivity of the sensor. If the connecting screw directly act on the baseboard, it might deform the baseboard, thus could alter the bolt pretension of the connecting screws and consequence in the change of the sensor’s sensitivity. With a tremendous amount of effort and experiments, we introduce the transmission collar to the manufacture process and eventually overcome the barrier. See Figure.3.
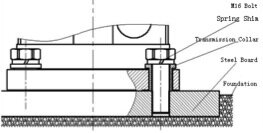
Figure.3
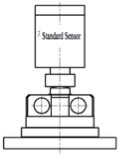
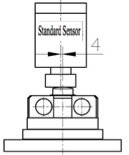
Regards to the second cause, there are several influencers including the foundation, the truck scale and the installations, etc. It is not as easy to control for the second cause. In order to obtain the ideal section difference, it requires more advanced anti-unbalanced load capacity and anti-sideway capacity of the sensor.
The cross-beam sensor is able to eliminate the unbalanced force and the sideway force due to its special cross – structure. The experimental data is listed as follows:
|
Load Value (t) |
Normal Test (mV/V) |
|||
 |
||||
|
|
Load 1 |
Load 2 |
Load 3 |
Average |
|
0 |
0.00000 |
0.00000 |
0.00000 |
0.00000 |
|
5 |
0.34185 |
0.34179 |
0.34180 |
0.34181 |
|
10 |
0.68364 |
0.68357 |
0.68355 |
0.68359 |
|
15 |
1.02546 |
1.02539 |
1.02537 |
1.02541 |
|
20 |
1.36724 |
1.36716 |
1.36716 |
1.36719 |
|
25 |
1.70905 |
1.70898 |
1.70900 |
1.70901 |
|
30 |
2.05092 |
2.05083 |
2.05083 |
2.05086 |
|
25 |
1.70930 |
1.70922 |
1.70922 |
1.70925 |
|
20 |
1.36773 |
1.36766 |
1.36767 |
1.36769 |
|
15 |
1.02555 |
1.02548 |
1.02555 |
1.02553 |
|
10 |
0.68373 |
0.68365 |
0.68367 |
0.68368 |
|
5 |
0.34188 |
0.34181 |
0.34183 |
0.34184 |
|
0 |
0.00005 |
0.00002 |
-0.00003 |
0.00001 |
|
Load Value (t) |
Eccentricity 4mm Test (mV/V) |
|||
 |
||||
|
|
Load 1 |
Load 2 |
Load 3 |
Load 4 |
|
0 |
0.00000 |
0.00000 |
0.00000 |
0.00000 |
|
5 |
0.34174 |
0.34189 |
0.34183 |
0.34182 |
|
10 |
0.68355 |
0.68368 |
0.68364 |
0.68362 |
|
15 |
1.02538 |
1.02540 |
1.02542 |
1.02540 |
|
20 |
1.36718 |
1.36721 |
1.36721 |
1.36720 |
|
25 |
1.70905 |
1.70906 |
1.70906 |
1.70906 |
|
30 |
2.05097 |
2.05098 |
2.05095 |
2.05097 |
|
25 |
1.70922 |
1.70926 |
1.70921 |
1.70923 |
|
20 |
1.36759 |
1.36761 |
1.36755 |
1.36758 |
|
15 |
1.02547 |
1.02553 |
1.02549 |
1.02550 |
|
10 |
0.68369 |
0.68375 |
0.68367 |
0.68370 |
|
5 |
0.34186 |
0.34191 |
0.34185 |
0.34187 |
|
0 |
0.00000 |
0.00000 |
0.00000 |
0.00000 |
|
Load Value (t) |
Declivity Test 2 °(mV/V) |
|||
|
|
||||
|
|
Load 1 |
Load 2 |
Load 3 |
Load 4 |
|
0 |
0.00000 |
0.00000 |
0.00000 |
0.00000 |
|
5 |
0.34192 |
0.34188 |
0.34197 |
0.34192 |
|
10 |
0.68376 |
0.68374 |
0.68379 |
0.68376 |
|
15 |
1.02558 |
1.02558 |
1.02561 |
1.02559 |
|
20 |
1.36744 |
1.36734 |
1.36741 |
1.36740 |
|
25 |
1.70926 |
1.70918 |
1.70922 |
1.70922 |
|
30 |
2.05112 |
2.05106 |
2.05108 |
2.05109 |
|
25 |
1.70945 |
1.70936 |
1.70940 |
1.70940 |
|
20 |
1.36785 |
1.36780 |
1.36777 |
1.36781 |
|
15 |
1.02571 |
1.02564 |
1.02562 |
1.02566 |
|
10 |
0.68393 |
0.68386 |
0.68385 |
0.68388 |
|
5 |
0.34200 |
0.34194 |
0.34196 |
0.34197 |
|
0 |
0.00002 |
0.00000 |
0.00000 |
0.00001 |
We did the following test in our factory.
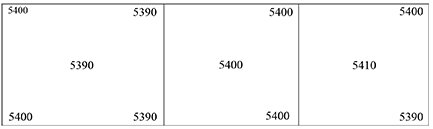
The testing truck scale is 150t, 3m x 16m, constructed by four sections (3 platforms which are 6m, 5m, and 5m). Utilize eight 30t cross-beam sensors. The surface condition is uneven whereas the surface difference itself is 3cm. We took the angular difference test under such unsatisfying circumstance.
Weight: 5400 kg; Division value:10 kg; Condition: prior to the adjustment for angular difference;
Test result: ±10 kg
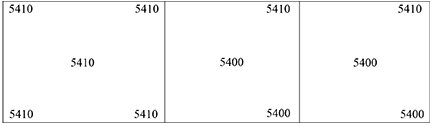
Switch to a smoother foundation
Weight: 5400 kg; Division value:10 kg; Condition: prior to the adjustment for angular difference;
Test result: ±10 kg
Shift Test:
The testing scale is 3m * 21m, it is divided into four sections: 6m, 5m, 5m, 5m, see Figure.4: utilize 10 40t cross-beam sensors.
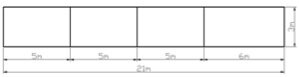
Figure.4
Load condition: weight 54t, truck weight (approx..) 20t, rear axis weight (approx..) 54.8 t (See Figure.5).
6 test points on single direction.
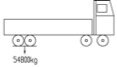
Figure. 5
Division value: 10 kg; Condition: prior to the adjustment for angular difference. The actual experimental data:
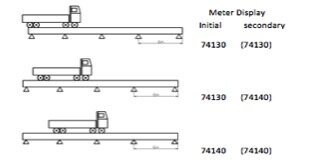
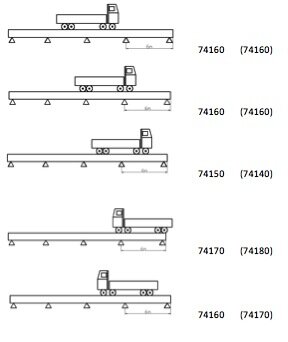
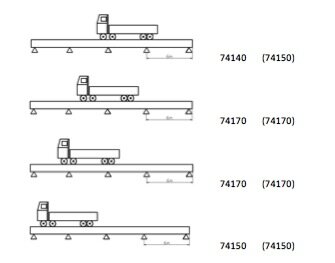
The scale passed the above test without any adjustment.
Introduction of the Triple Ball Module
In order to guarantee the mobility of the scale and decrease the stress to the sensor, our company developed the triple ball module as the compressional head. See Figure.6.
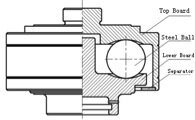
Figure.6
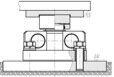
The triple ball module is mainly constructed by a top board, a lower board, three steel balls and a separator. According to the principle that three points determine a plane. Three stress points (the steel balls) are distributed evenly with 120°. The bearing point takes effect within the equilateral triangle formed by the three stress points, which assures the stability of the truck scale. See Figure.7.
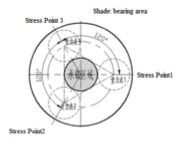
Figure.7
We adopt the double layer design, which utilize the steel ball and the bowl. When the steel ball is off-track of the lowest point of the bowl, due to gravity factor, it forces the compressional head to return to the original point automatically. Meanwhile, the upper level of the module can move freely without taking relative displacement with the contact point of the sensor, which assures the precision of the measurement. See Figure.8.
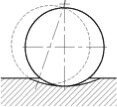
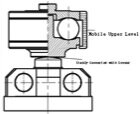
Figure.8
We utilize a stop block device including the blocking round-hole and the blocking column to get the same spacing within 360°direction. The shade area in Figure.9 is the mobile area.
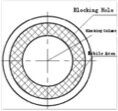
Figure.9
The calculation of the contact stress between the steel balls
Regard as two inscribed balls with radius being respectively R1 and R2. Under the pressure P, it forms a circular interface with the radius being a. According to the Hess Formula, we can get:
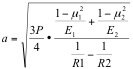
E1, E2 are respectively the elasticity modulus of the material.
μ1, μ2 are respectively the Poisson’s Ratio of the material.
Since the two materials are both steel, we can simplify the calculation by regarding E1=E2=E,μ1=μ2=0.3
Thus we can get the contact stress formula:
![]()
The material standard is 40 Cr, E=190GPa,σS=785MPa, σb=980MPa, to adapt to the 30t sensor’s triple ball module. The scales is shown as in Figure.10:
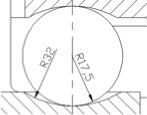
Figure.10
Bring in the date, then get
![]()
4. Common structures of the cross-beam sensor
(1) The combination of raised head bolt + triple ball module. This combination is applicable for truck scale and hopper scale, etc.


![]()
Figure. 11
(2) The combination of a cup head bolt + steel balls +compressional head. This combination is applicable for truck scale and etc.
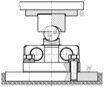
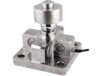
Figure. 12
(3) The combination of raised head bolt + stable compressional head. This combination is applicable for truck scale, axis load scale and hopper scale, etc.

![]()
Figure. 13
In 2012, GF-11 cross-beam load cell got NTEP approval with 1:10,000 divisions, which means the whole idea of this new design works and it can be put into service in the field.
Comments
![]()
![]()
![]()
![]()
![]()
![]()
![]()
![]()
![]()
![]()
My Account
- Orders
- Compare list
- My tags
- Events
- Return requests
- Wish list
- Subscriptions